
 Hyros
HyrosUS$69/moAI Tracking
Up to US$5,000 in tracked monthly revenue; published monthly rateReview performance across the sales journey
Traffic, campaign and CRM reports in one place
View plan and terms ↗Your identity. Your team. Your marketing.
Funnels, web, email, social, YouTube, CRM, live events and ads in Stats.
Iris · Stats
Bring visits, content, ads and business opportunities into Stats. Open each dashboard, compare periods and decide where to act.

IrisOne specialty in your AI team
Fewer tools. More marketing.
HyrosReview performance across the sales journey
Traffic, content and conversions in your marketing reports, so you can decide where to focus next.
Your business data, closer.
Illustrative example. Available data depends on your account and its connections.
How the work begins
Open Stats and bring the results of your connected accounts into one view.
Move from funnels and traffic to email, social, YouTube, CRM, live events and Ads. Each area has its own views.
Review periods, pages, sources or stages according to the report. Apply what you learn to your content, campaign or sales follow-up.
Your tools
In your business
Check page visits and form submissions, then review the opportunities in your CRM.
Review social or YouTube performance to decide which content to work on.
Select the account and explore its traffic, content and sales reports.
CUSTOMER STORIES
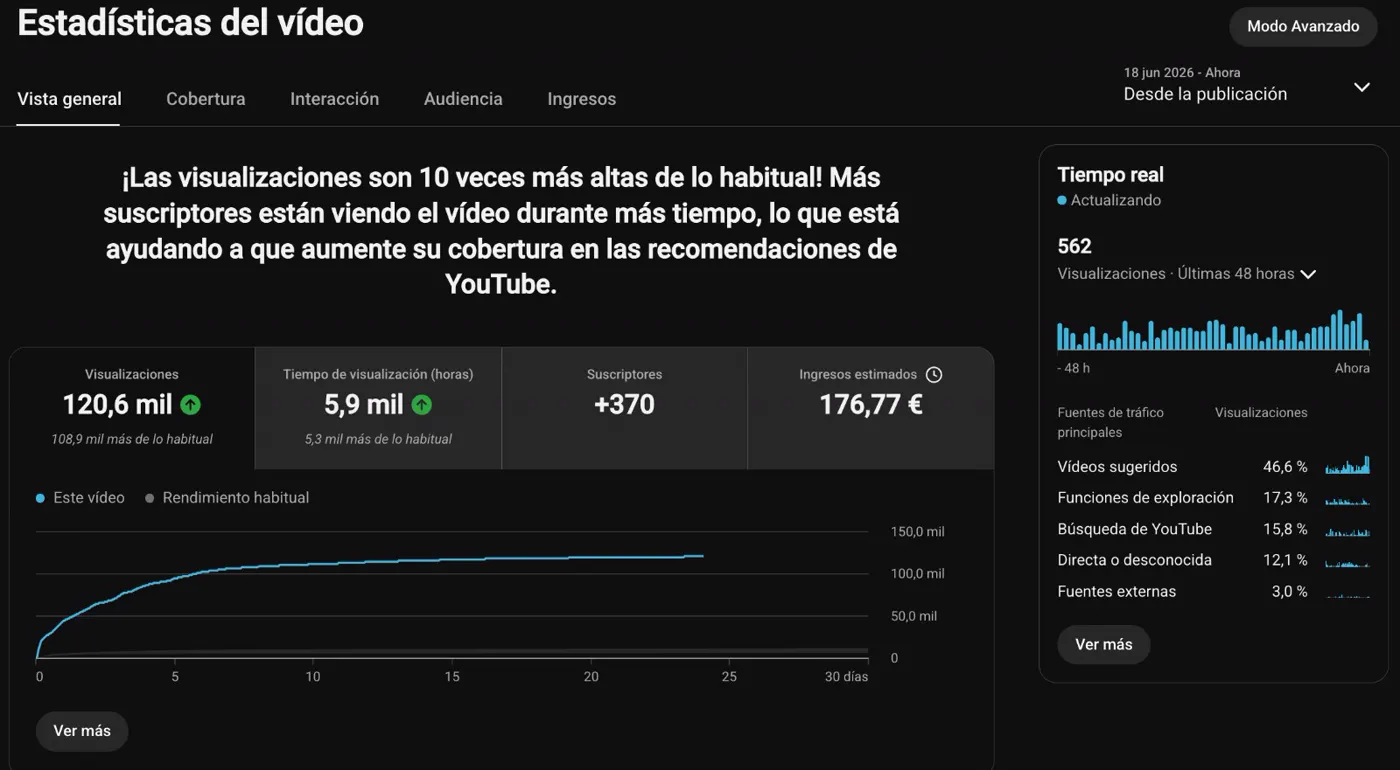
10× its usual performance
His AI-produced video passed 120,000 views. YouTube highlighted performance ten times above the channel’s usual level.
Since publication on June 18, 2026. Screenshot published in July 2026.
“None of my long-time followers noticed that I was no longer recording myself.”

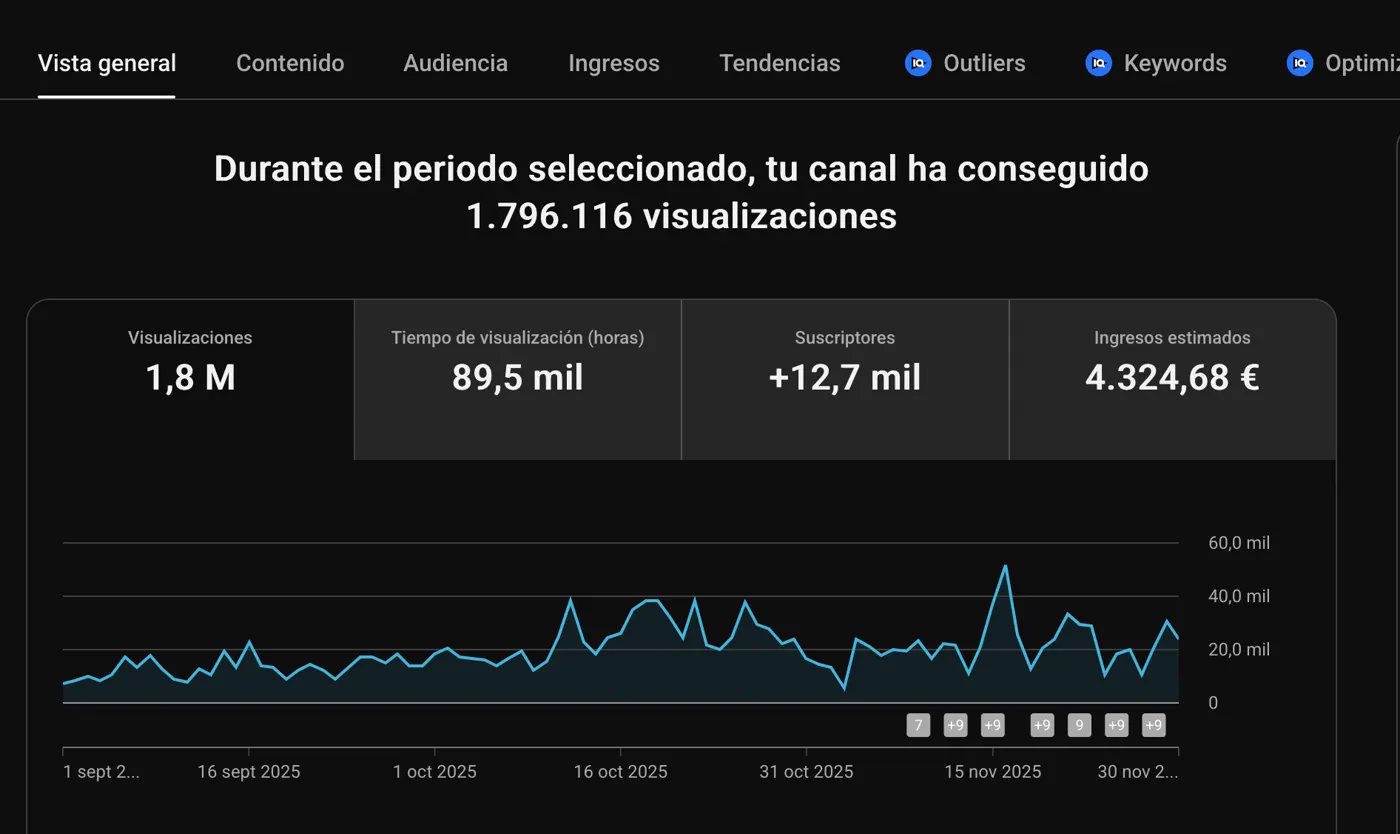
1,796,116 in the period shown
His channel has worked with his clone since October 2024. It reached 1,796,116 views in the quarter shown.
The 2025 quarter shown. Case published in July 2026.
“I stopped recording myself in October 2024.”

Figures and testimonials published in the Crea tu Clon IA offer, July 2026. Testimonials translated from Spanish. View the original cases ↗
Your questions answered
Start with your goal: visits, conversations or opportunities. Iris brings dashboards together so you can review the area you need.
Explore traffic, funnels and CRM opportunities from Stats. Review each stage to decide where to focus your next improvement.
Use each dashboard’s filters to review dates, sources, pages and stages. Compare results with the context of what you published.
Stats brings together access to YouTube, social, email, web, CRM and advertising. Open the channel you want to analyze.
Use metrics to choose which content to strengthen, campaign to review or follow-up to resume. Take that decision to the relevant AI team specialty.
Your starting point
Start with ContentFlow365. Explore the plans and choose the features you want to put to work.
Find the plan for the way you work.Your identity. Your team. Your marketing.